
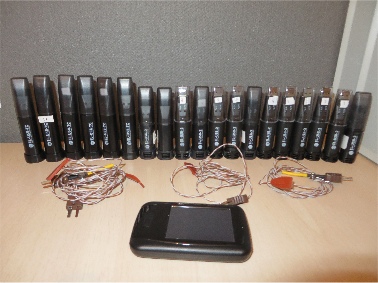
This picture shows our specialist atmospheric data loggers that can be used to measure internal and external environmental conditions.
Data is king!
Data logging is very important, most condensation surveys are a snap shot in time. It is sometimes necessary when there has been a long term problem and there is a dispute. This paints a picture of what is really going on, and is normally used in disputes for Housing Associations, and landlords.
See the visual graphs showing what is actually happening every 30 minutes. I must emphasise that simply using an internal data logger isn’t really good enough, you will also need surface temperature measurement to show when a wall is below dew point (condensation occurring), and an external data logger so you can show the differential vapour pressure, all of this is then put into a specialist Excel spreadsheet to produce our graphs.
Below is an example of where we used our data logging to prove that the problem was condensation and not rising damp, this saved our customer potentially thousands of pounds.
We have just carried out a damp survey for a national building company that builds housing estates. The company will not be named, what I will say is in there defence they chucked money at this problem and went all out to fix it, unfortunately they were badly advised from the off.
The property in question is only 3 years old, it’s in excellent condition, but it had suffered from an escape of water a few weeks after the purchasers moved in. They moved out, a drying company dried the building down and issued a drying certificate….happy days!
A few months later there were a few dampness problems, mainly at low levels.
They had a few different surveys from all different types of building surveyors, damp surveyors, including so-called thermal imaging experts…….
2 years later and the problem still wasn’t fixed, people were still guessing, this is when we had the initial enquiry. The enquiry was simple, find and fix this problem and there isn’t a limit on fees. I haven’t heard this before, I asked have you got any data from the previous surveys “No” was the answer. Data is king in any survey, especially on a survey like this. A damp meter is excellent along with basic condensation assessment kit, this is all snap shot at that specific time, don’t get me wrong its useful, but it has it’s limitations.
My recommendations for the survey were full data logging of the internal environment, a gravimetric profile to BRE Digest 245, and data logging the floor with a hygrometer box. All of these things will produce data that we can use to help us evaluate what is going on with the building.
The survey was carried out and dampness was noted in a few areas at low level.
This is what data we collected which we used for our conclusion.
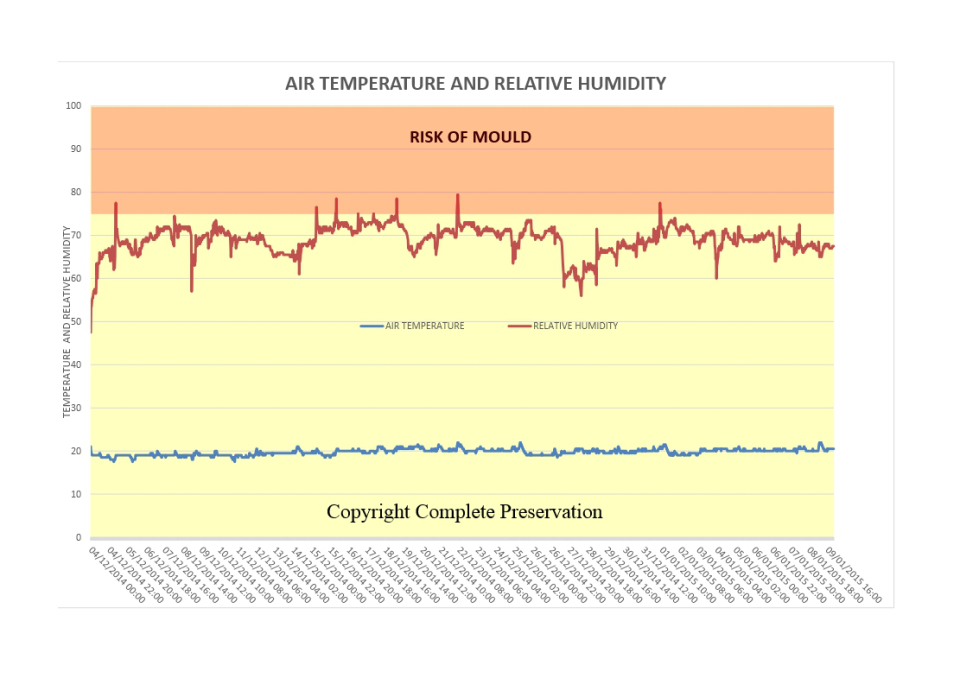
1. Basic data is collected as in the graph below, this shows the temperature and relative humidity. This shows high humidity, at 20 degrees.
2. Using specialist graphing facilities in Excel we can start producing graphs showing all different types of data.
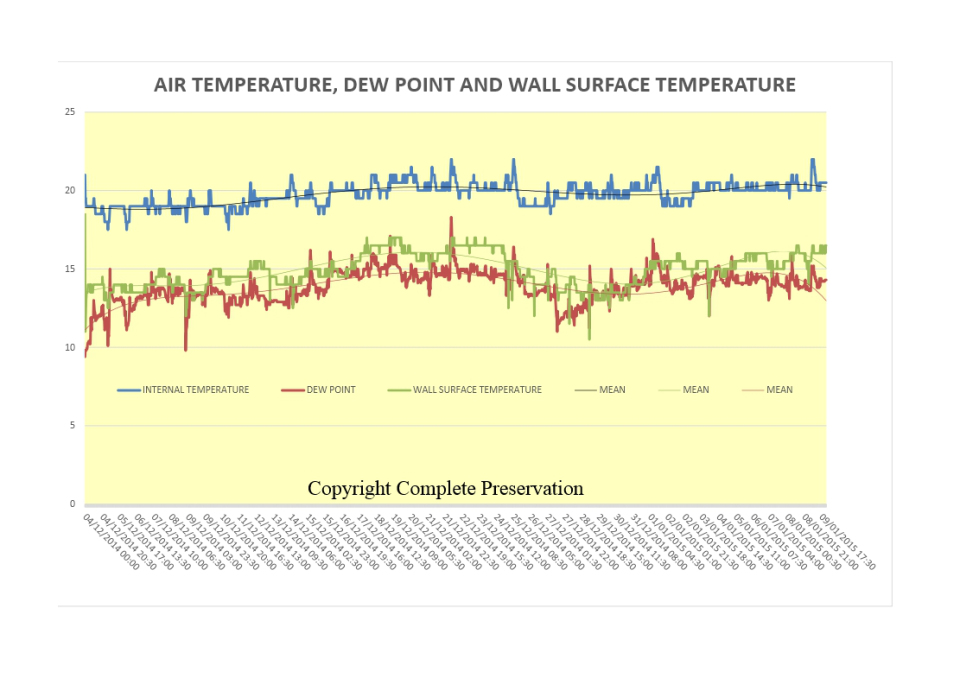
The below graph shows how important it is to use wall surface temperature data loggers, the above graph doesn’t tell you anything about condensation occurring just high humidity. In the below graph you can see every now and then the wall surface temperature drops below the dew point and condensation is occurring at that specific time.
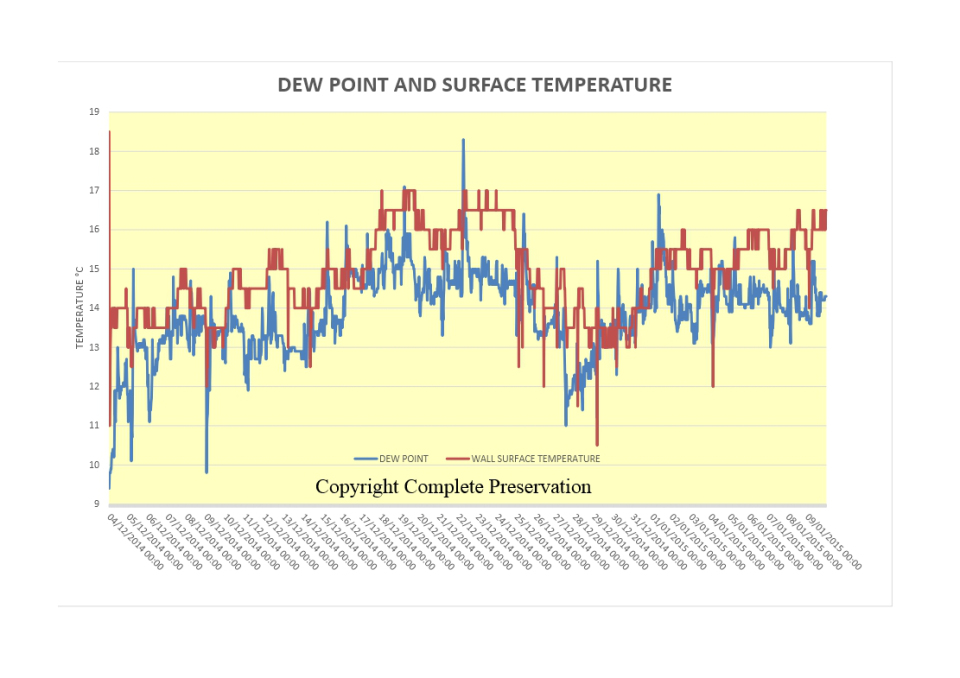
3. The below graph shows the dew point and surface temperature, also when condensation is occurring.
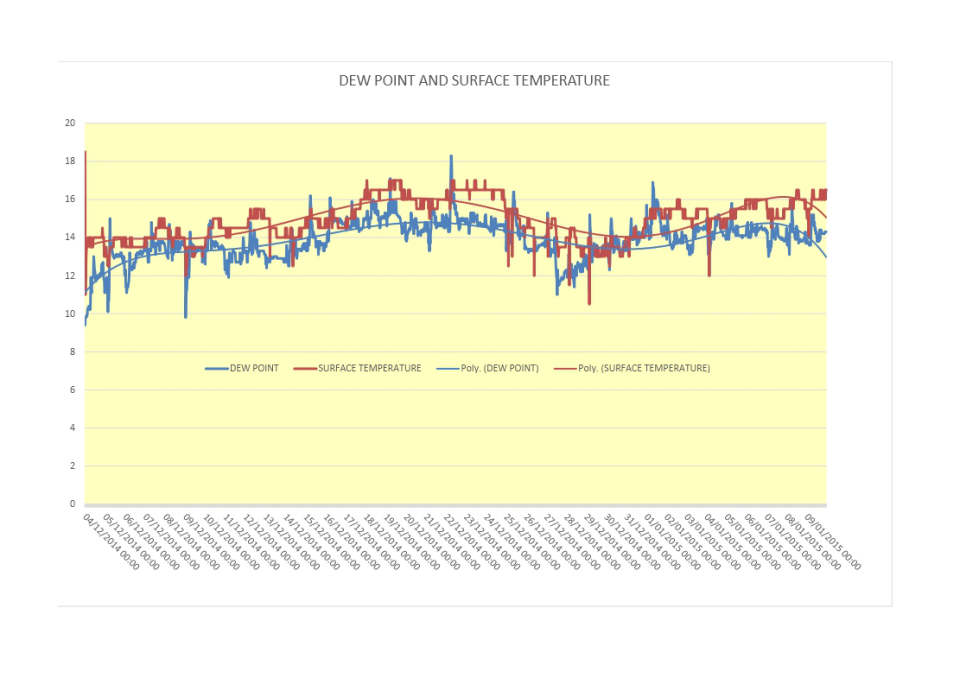
4. This is a close up of the above graph (3.), this is just a better visual showing how the wall and dew point temperature virtually mirror each other, but also when condensation is occurring.
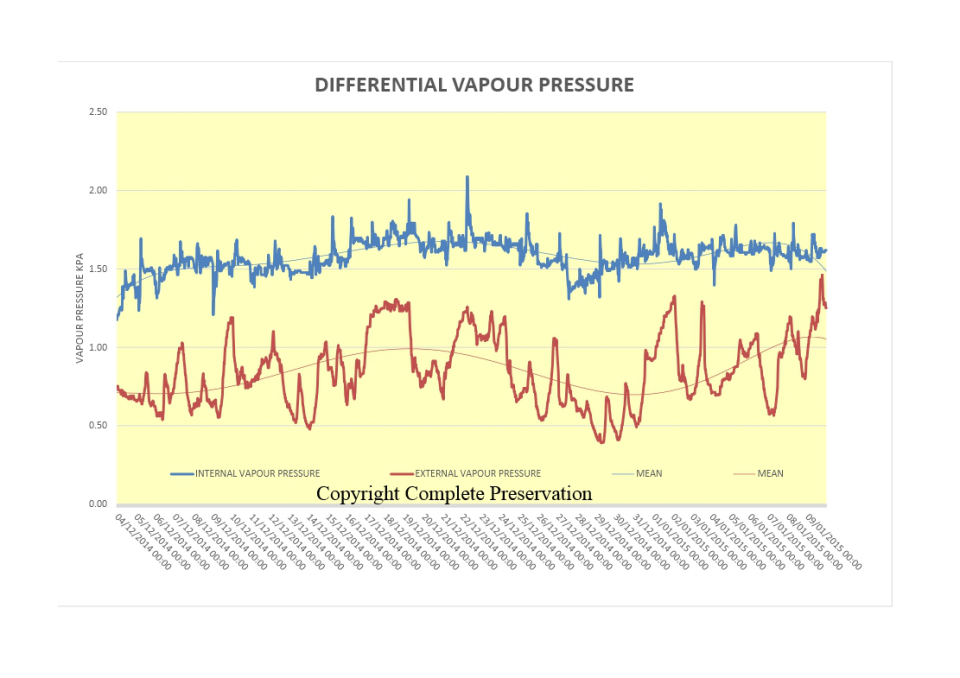
5. Differential vapour pressure is showing this is a wet environment, averaging around 0.70kpa difference using the mean, sometimes when it spikes it can be around 0.95kpa.
This shows the benefit of long-term data logging compared to snap shot data, the condensation didn’t occur on a regular basis, it mainly happened in the early hours or first thing in the morning…….. Not when a surveyor would have been on site!
The problem was caused by defective extraction, there were extraction fans in both the kitchen and the bathroom, extractions fans are centralised in the building which means the ducting is long. Unfortunately the installer used cheap pvc ducting hose which was taped at the joints. They should of used rigid ducting with jubilee clips where terminating to the external grill. Because of this distance, and the defects / wrong ducting, this caused the fans to under achieve the litres per second they were designed for. Which resulted in the moisture being produced in the property with know where to go, and subsequently caused the condensation problem.
This saved my client thousands of pounds of unnecessary works, they thought floors would have to be taken up and replaced, it also saved the home owner of moving out of their property for a second time.